

I'm posting a little different analysis of financials to try to focus on a single number that matters. I talk a lot about cash and liquidity, but that's only part of the story since plenty of businesses are bankrupt but OK on cash and the ability to pay its bills.
Net position sounds a little abstract, but it's perhaps the truest indicator of profit. When it increases, your revenues exceeded expenses, and vice versa. To see whether you're able to fund yourself, you only need to look at your change in net position.
Unfortunately, it tends to move around a bit in U of L's case. We have generally seen net position decline in athletics, but the ups and downs make it difficult to detect an underlying trend. I'm personally looking for any trend that tells me U of L's financial direction is changing. Here is a plot of the change in U of L's net position over the last several years...
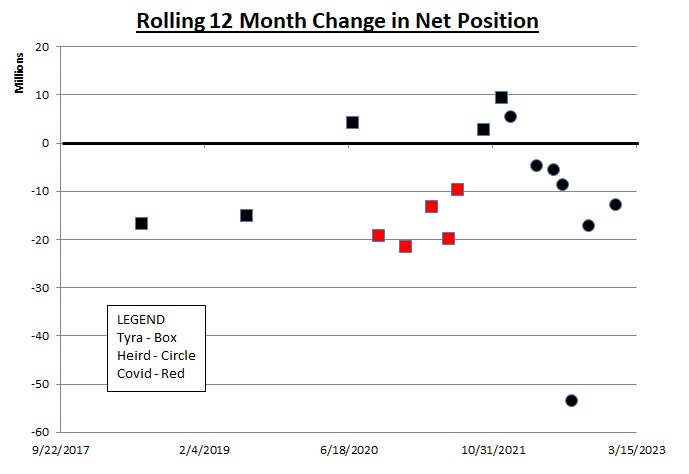
A positive value is a surplus for the prior 12 months, and a negative value is a deficit. I'm using a rolling one year average at each data point for a couple reasons. The first as I like to say is because a single number or snapshot doesn't mean a lot; you have to reference something. So this shows progress or decline over a period of time. And the time increment here is important. U of L's athletics revenues are lumpy and uneven over the course of a fiscal year. It's not accurate to do, for example, a three-month or six-month comparison.
Most of the data points are below the zero line indicating losses. Assuming the value on 7/31/22 is a simple outlier, the Covid data points are not surprisingly on the low end of the range as are Josh Heird's last couple of data. The average of all the data except the 7/31/22 number is a decline of $8.8 million annually.
To compress the data range and maybe detect a trend, I applied a 24-month rolling average. More data are always better, and this unfortunately reduced the data set from 17 to 10 data points. All of the values are negative so I'm showing the results here as the rolling 24-month DECLINE in net position. A lower value is therefore better...

The last few points show an interesting trend, but they're inside the range of data for the entire set. The two-year average for these values is $16.3 million, and an average of $8.1 million annually.
For the hell of it, I also crunched three-year rolling averages that yielded just five data points...
6/30/2020 -$27,391,000
6/30/2021 -$20,372,000
6/30/2022 -$13,945,000
9/30/2022 -$33,390,960
12/31/2022 -$28,694,669
These values average a three year decline of $24.8 million, or an annual decline of $8.3 million.
Visually or arithmetically, it's hard to see any recent improvement in net position that would indicate a bottoming out in U of L's decline. If anyone else sees something, speak up. @Ipartiedwithhopgood this one's for you...
Net position sounds a little abstract, but it's perhaps the truest indicator of profit. When it increases, your revenues exceeded expenses, and vice versa. To see whether you're able to fund yourself, you only need to look at your change in net position.
Unfortunately, it tends to move around a bit in U of L's case. We have generally seen net position decline in athletics, but the ups and downs make it difficult to detect an underlying trend. I'm personally looking for any trend that tells me U of L's financial direction is changing. Here is a plot of the change in U of L's net position over the last several years...
A positive value is a surplus for the prior 12 months, and a negative value is a deficit. I'm using a rolling one year average at each data point for a couple reasons. The first as I like to say is because a single number or snapshot doesn't mean a lot; you have to reference something. So this shows progress or decline over a period of time. And the time increment here is important. U of L's athletics revenues are lumpy and uneven over the course of a fiscal year. It's not accurate to do, for example, a three-month or six-month comparison.
Most of the data points are below the zero line indicating losses. Assuming the value on 7/31/22 is a simple outlier, the Covid data points are not surprisingly on the low end of the range as are Josh Heird's last couple of data. The average of all the data except the 7/31/22 number is a decline of $8.8 million annually.
To compress the data range and maybe detect a trend, I applied a 24-month rolling average. More data are always better, and this unfortunately reduced the data set from 17 to 10 data points. All of the values are negative so I'm showing the results here as the rolling 24-month DECLINE in net position. A lower value is therefore better...
The last few points show an interesting trend, but they're inside the range of data for the entire set. The two-year average for these values is $16.3 million, and an average of $8.1 million annually.
For the hell of it, I also crunched three-year rolling averages that yielded just five data points...
6/30/2020 -$27,391,000
6/30/2021 -$20,372,000
6/30/2022 -$13,945,000
9/30/2022 -$33,390,960
12/31/2022 -$28,694,669
These values average a three year decline of $24.8 million, or an annual decline of $8.3 million.
Visually or arithmetically, it's hard to see any recent improvement in net position that would indicate a bottoming out in U of L's decline. If anyone else sees something, speak up. @Ipartiedwithhopgood this one's for you...
Last edited:
