[I made this post and another on basketball attendance a couple days ago, both of which disappeared for some reason. Neither was particularly contentious, at least by my standards, so not sure what happened. I’m writing it off to a system glitch of some type unless I find out otherwise. This one on gifts was requested by a couple posters on premium. If it remains, I’ll repost the second on attendance…]
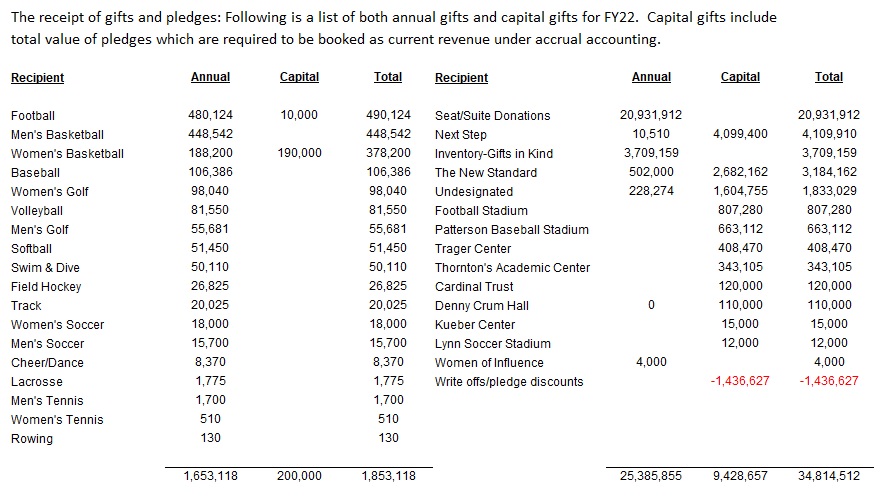
This post addresses questions about the status of gifts to the athletic department based on what U of L reports annually. The most recent report was uploaded about a month ago for fiscal year 2023 ending 6-30-2023.
I’m presenting all of the pertinent ULAA audited info in my possession going back to FY2004.
To understand the situation with gifts, I’m presenting all the main categories of revenues and expenses on the income statement: (1) operating revenues, (2) gifts or nonoperating revenues, and (3) expenses. Gifts make up almost 100% of nonoperating revenue. The sum of (1) and (2) for a nonprofit should come close to (3) since by definition a nonprofit doesn’t generate profit.
Starting with a simple table focusing on the endpoints of my available data…
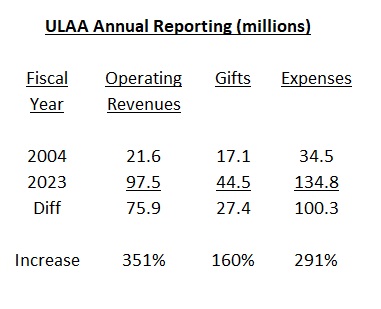 It’s easy to spot an issue with gifts not keeping up with expenses and other/operating revenues over these two decades. While operating revenues have led the way, $40 million of the $76 increase is conference, media, and NCAA revenue, the majority of which is due to ACC membership. It hasn’t been U of L driving its own operating revenues to that extent. By the way, I should add that “gifts” are the total of two items on the income statement, capital gifts and a general line item for everything else.
Here’s a graph showing as-is dollar amounts for these categories on the annual reports. Again, the black and red line graphs sum closely to the green line, and do exactly when the budget is in balance…
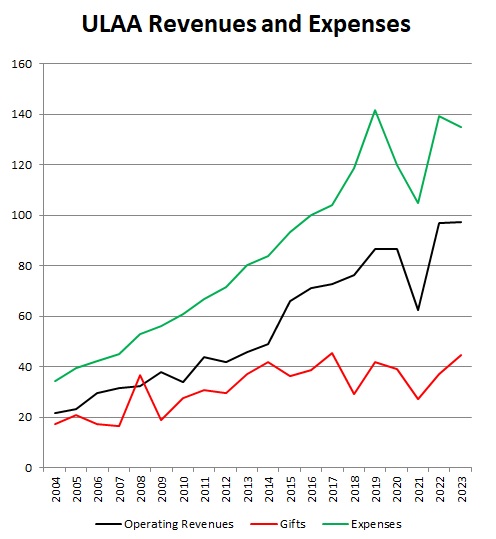
There’s a lot of variability in gifts due to capital fundraising like a stadium expansion. And the sudden drop in the black and green plots is due to Covid (2021). To scale these categories proportionately and remove some of the year-to-year noise, I prepared a normalized graph using a five-year moving average. Here’s that data also omitting the Covid year…
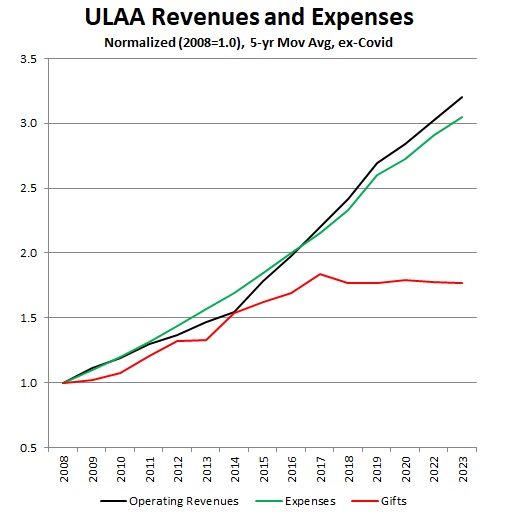 The plots separate a bit in 2014 as the contribution of ACC revenue starts to inflate operating revenues while expenses keep pace. And after 2017, gifts have flattened out. The 2017 data point for gifts on the prior chart is the high water mark at $45.4 million. None of these charts are adjusted for inflation, so gifts have been declining on an equal purchasing power basis (inflation adjusted down 21% since 2017).
Therefore, expenses and operating revenues keep pace. I would summarize U of L's financial issues as follows: expenses have kept increasing while gifts have leveled off...
This post addresses questions about the status of gifts to the athletic department based on what U of L reports annually. The most recent report was uploaded about a month ago for fiscal year 2023 ending 6-30-2023.
I’m presenting all of the pertinent ULAA audited info in my possession going back to FY2004.
To understand the situation with gifts, I’m presenting all the main categories of revenues and expenses on the income statement: (1) operating revenues, (2) gifts or nonoperating revenues, and (3) expenses. Gifts make up almost 100% of nonoperating revenue. The sum of (1) and (2) for a nonprofit should come close to (3) since by definition a nonprofit doesn’t generate profit.
Starting with a simple table focusing on the endpoints of my available data…
Here’s a graph showing as-is dollar amounts for these categories on the annual reports. Again, the black and red line graphs sum closely to the green line, and do exactly when the budget is in balance…
There’s a lot of variability in gifts due to capital fundraising like a stadium expansion. And the sudden drop in the black and green plots is due to Covid (2021). To scale these categories proportionately and remove some of the year-to-year noise, I prepared a normalized graph using a five-year moving average. Here’s that data also omitting the Covid year…
Therefore, expenses and operating revenues keep pace. I would summarize U of L's financial issues as follows: expenses have kept increasing while gifts have leveled off...
Last edited: