

A lot is made of Louisville’s performance in this series without IMO a corresponding amount of analysis. Specifically, do the results indicate some type of underperformance with respect to LPT compared to other teams that U of L plays? In order to understand that, you have to account for how good/bad the two teams are during the time period of interest.
I looked at won-lost records for the modern series based on two factors: home vs. road (since some fans think LPT “owns” U of L’s home venue), and the quality of each team as measured by their final ranking. I started using the RPI which the NCAA uses to seed teams, but I couldn’t find RPI data prior to 1999. So, I also used AP Top 25 rankings between 1983 and 1998. There were two early years, 1985 and 1987, in which neither team was ranked in the final AP poll. I looked at final rankings as the truest measure of quality, how good each team actually was based on their full season’s body of work.
I can post the individual data points, but the summary is most useful. Here is my approach to summarizing more than three decades and the 37 games involved. All of these are records for U of L unless otherwise stated, “home” is in Louisville, “road” is at Rupp Arena, and “neutral site” is neither in Lexington or Louisville…
And pooling these numbers, the following more general stats result…
And now my analysis of these results from the top-down... None of these results are unexpected for any two teams in competition. You can look at any grouping by factor above to gauge that. There is quite clearly a home/road bias for both teams. The raw numbers skew negative for U of L simply based on how much higher LPT has been ranked nationally over the years.
U of L is 12-25 in the modern-day series. Yet, U of L has finished the year as the better team for only 7 of the 35 games in which one of the two teams was ranked by season’s end. (Again, for two early games in the series, neither team was ranked by AP at the end of the year.) With 12 victories and only 7 instances of competing as the better team, U of L has arguably OUTPERFORMED in the games against LPT.
Another example of that has been our performance in those 7 games retrospectively judged as the better team: 6-1, or 85.7 winning percentage. Compare that to LPT’s performance as the better team: 23-5, or 82.1%. Not much difference, but U of L has performed slightly better as the better team. (And likewise, slightly better—17.9% vs. 14.3%—as the inferior team.)
With only those 7 data points, it’s difficult to make a home-road analysis as the better/worse team. It’s also difficult to make determinations about true neutral site games since there are only three examples of games played in the modern series outside of Kentucky. Disregarding small quantities of available data, a won-lost percentage matrix can be constructed with all of these combinations. Here is the result…
When you lose this game, it’s not because LPT “has Louisville’s (or Pitino’s) number”, because they win disproportionately in Louisville, because U of L chokes rivalry games more than they do, or any other garbage you believe or have been fed that isn’t objectively based. When that happens, it’s much more likely that the slappies have fielded a better team compared to U of L—or another team. There’s nothing unique about Louisville playing them. And if you don’t like NOT having the better team more often, that’s not an LPT issue unless you make it one. My analysis of that perspective is “little brother syndrome”—you’re fixated on being better so you can beat them.
If there is a legit and constructive takeaway from this game, it’s that the result has a pretty good correlation with how good your team is by the end of the year. On average, it doesn’t yield too many results that are hard to explain by season’s end, in either direction for either team. That alone doesn’t justify playing the game, but it does mean the results aren’t random.
“Elite program”, my a$$...
I looked at won-lost records for the modern series based on two factors: home vs. road (since some fans think LPT “owns” U of L’s home venue), and the quality of each team as measured by their final ranking. I started using the RPI which the NCAA uses to seed teams, but I couldn’t find RPI data prior to 1999. So, I also used AP Top 25 rankings between 1983 and 1998. There were two early years, 1985 and 1987, in which neither team was ranked in the final AP poll. I looked at final rankings as the truest measure of quality, how good each team actually was based on their full season’s body of work.
I can post the individual data points, but the summary is most useful. Here is my approach to summarizing more than three decades and the 37 games involved. All of these are records for U of L unless otherwise stated, “home” is in Louisville, “road” is at Rupp Arena, and “neutral site” is neither in Lexington or Louisville…
As better team at home: 3-1 (0.750)
As worse team at home: 3-7 (0.300)
As better team on road: 2-0 (1.000)
As worse team on road: 2-14 (0.125)
As better team at neutral site: 1-0 (1.000)
As worse team at neutral site: 0-2 (0.000)
When neither team is ranked: 1-1 (0.500)
As worse team at home: 3-7 (0.300)
As better team on road: 2-0 (1.000)
As worse team on road: 2-14 (0.125)
As better team at neutral site: 1-0 (1.000)
As worse team at neutral site: 0-2 (0.000)
When neither team is ranked: 1-1 (0.500)
And pooling these numbers, the following more general stats result…
As better team: 6-1 (0.857)
As worse team: 5-23 (0.179) – LPT as better team: 23-5 (0.821)
As worse team: 5-23 (0.179) – LPT as better team: 23-5 (0.821)
At home: 7-9 (0.483)
On road: 4-14 (0.222)
On road: 4-14 (0.222)
Neutral site: 1-2 (0.333)
And now my analysis of these results from the top-down... None of these results are unexpected for any two teams in competition. You can look at any grouping by factor above to gauge that. There is quite clearly a home/road bias for both teams. The raw numbers skew negative for U of L simply based on how much higher LPT has been ranked nationally over the years.
U of L is 12-25 in the modern-day series. Yet, U of L has finished the year as the better team for only 7 of the 35 games in which one of the two teams was ranked by season’s end. (Again, for two early games in the series, neither team was ranked by AP at the end of the year.) With 12 victories and only 7 instances of competing as the better team, U of L has arguably OUTPERFORMED in the games against LPT.
Another example of that has been our performance in those 7 games retrospectively judged as the better team: 6-1, or 85.7 winning percentage. Compare that to LPT’s performance as the better team: 23-5, or 82.1%. Not much difference, but U of L has performed slightly better as the better team. (And likewise, slightly better—17.9% vs. 14.3%—as the inferior team.)
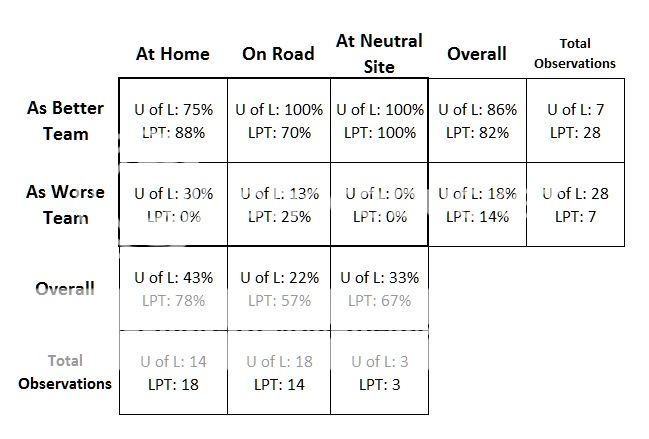
With only those 7 data points, it’s difficult to make a home-road analysis as the better/worse team. It’s also difficult to make determinations about true neutral site games since there are only three examples of games played in the modern series outside of Kentucky. Disregarding small quantities of available data, a won-lost percentage matrix can be constructed with all of these combinations. Here is the result…
When you lose this game, it’s not because LPT “has Louisville’s (or Pitino’s) number”, because they win disproportionately in Louisville, because U of L chokes rivalry games more than they do, or any other garbage you believe or have been fed that isn’t objectively based. When that happens, it’s much more likely that the slappies have fielded a better team compared to U of L—or another team. There’s nothing unique about Louisville playing them. And if you don’t like NOT having the better team more often, that’s not an LPT issue unless you make it one. My analysis of that perspective is “little brother syndrome”—you’re fixated on being better so you can beat them.
If there is a legit and constructive takeaway from this game, it’s that the result has a pretty good correlation with how good your team is by the end of the year. On average, it doesn’t yield too many results that are hard to explain by season’s end, in either direction for either team. That alone doesn’t justify playing the game, but it does mean the results aren’t random.
“Elite program”, my a$$...
Last edited:
