
Just received a copy of the Q4 financials for ULAA FY2023. Here's an updated plot of "net cash" with the new data point (green bar on the lower right)...

The two most recent, year-over-year green bars show a decline of $935 thousand which is a good improvement generally for the YOY comparisons in the chart.
I need to comment that this latest data point is from an UN-audited report by U of L circulated internally; the other green bars above are from the annual audited reports. To gauge that bias, I calculated last year's net cash from the unaudited report. It was $1.997 million higher than net cash is now. So, a decline of $935 thousand from last year may overstate the audited result by about a million dollars. We'll know in a few months.
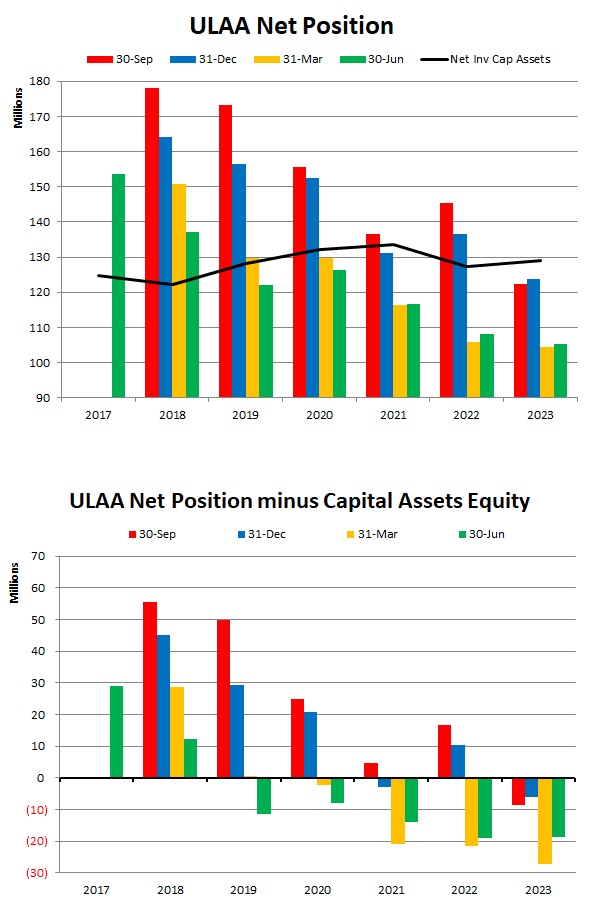
With the caveat that I've been fooled before looking for things to bottom, the decline in net cash may be improving. Following is a similar analysis of net position...
The two most recent, year-over-year green bars show a decline of $935 thousand which is a good improvement generally for the YOY comparisons in the chart.
I need to comment that this latest data point is from an UN-audited report by U of L circulated internally; the other green bars above are from the annual audited reports. To gauge that bias, I calculated last year's net cash from the unaudited report. It was $1.997 million higher than net cash is now. So, a decline of $935 thousand from last year may overstate the audited result by about a million dollars. We'll know in a few months.
With the caveat that I've been fooled before looking for things to bottom, the decline in net cash may be improving. Following is a similar analysis of net position...