ADVERTISEMENT

2022 FBS Football Attendance

the artist FKA zipp

4500+
Gold Member
May 29, 2022
4,566
1,757
26
Discovered an interesting website recently that I don't recall previously. Here's the LINK. It's an interactive list of 130 FBS schools showing football attendance. They present 2022 attendance compared to 2021 and a five-year average. The webpage is devoid of info for how the calculations were made and where the data come from. The source is presumably an NCAA database somewhere.

I checked the calculation for U of L with particular interest in the five-year number. That one is the average for the five years 2016-2021 inclusive but omitting the Covid year of 2020. The number was spot on with what U of L reported as tickets sold, and I assume the rest of the schools were reported similarly.

After exporting the data to Excel, I plotted the cumulative distributions for the one- and five-year rankings by percentage change in attendance. The enlarged data point on the five-year chart below is for U of L.

FBS-five-years.jpg

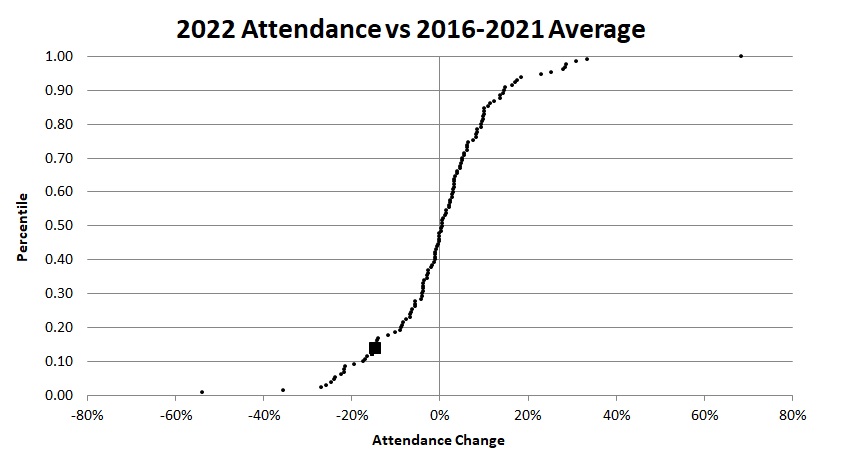
Percentile is a convenient stat for where you rank nationally. U of L football attendance for 2022 sits at the 14th percentile with a -15% change vs our five-year average prior. The median percentage change for this distribution--where the data cross the 50th percentile line--is +0.33%.

The data plot for year-over-year change (2022 v 2021) looks similar, and I'll post it if anyone wants to see it. The comparable numbers for U of L are a 5% decline and the 18th percentile. The one year median change in FBS attendance nationally was an increase of 6%.

We hear a lot of talk about declining attendance trends "everywhere." These numbers do not support that. It was slightly positive on a long term basis and significantly positive year over year. You can probably explain that trend as a recovery from Covid in 2020. People are showing a greater return, relatively speaking, on a short term basis.

What's also clear is that U of L attendance significantly lags FBS schools nationally. I also looked at just the ACC schools, and we're only ahead of Georgia Tech. That means we lag Boston College, Duke, and Syracuse, among others. We didn't even appear to be "bottoming out" last year; our 18% year-over-year percentile nationally is almost as low as the comparable five-year value of 14%. We're ranked badly on either basis.

Every school went through Covid, everyone has expensive beer, bad weather, and a fanbase with large HDTVs in their living rooms. I'm not looking at an overlay of won-lost records, but we went to a bowl game last year. And while Satterfield won't be missed, his .500 record over his four years is pretty close to average. However, our attendance is nowhere close to average. I'm out of explanations that make sense except for one.

Obviously we can talk about Jeff Brohm with a lot of hope. But everything and everyone else is staying the same...
 
Last edited:
Interesting numbers….a little surprised that national attendance rose 6%. The Cards had a competent Coach but not an exciting style IMO. Coach Satts flirtation with UNC and the teams inability to compete with UK hurt attendance. Brohm will put more butts in the seats. The declines in attendance in the two major sports hurt the coffers for sure. Both sports should be better this year.
 
Bob, I hope football attendance is 99% about the head coach, but I doubt it. You don’t IMO get where we are in attendance for football and men’s basketball based on the coaches alone or their results. We’ll start to find out in a few months…
 
If you are looking for a common denominator, look at the attendance differential between the larger urban schools like UL, UC, Memphis, GT, Miami, Syracuse, Houston, Tulane where the schools are competing with far more entertainment venues than say, those schools in communities where the Universities are the primary focus of entertainment.

An example of the contrast can be seen between UK (Lexington) and UL (Louisville); where UK hosted the Regional NCAA baseball tournament in Lexington, but had inadequate hotel facilities to house the 3 schools invited as guests ……… yet there were almost 7,000 fans in attendance to watch the game. Not much else going on in Fayette Co that weekend.

Tuscaloosa, Athens, Ann Arbor, East Lansing, College Station and Happy Valley are examples of smaller communities tied closely to their respective Universities, which makes those Saturday Football games such a huge attraction for both entertainment, social opportunities and traditional fan interest.
 
An example of the contrast can be seen between UK (Lexington) and UL (Louisville); where UK hosted the Regional NCAA baseball tournament in Lexington, but had inadequate hotel facilities to house the 3 schools invited as guests ……… yet there were almost 7,000 fans in attendance to watch the game. Not much else going on in Fayette Co that weekend.
Umm, the Railbird Featival - a multi day music event featuring lots of nationally well known acts was being held at the Red Mile that weekend. It was arguably the largest music festival in the country that weekend and it was the thousands of attendees that snapped up all of the Lexington and surrounding areas hotel rooms.
 
  • Like
Reactions: fredburgcard
Umm, the Railbird Featival - a multi day music event featuring lots of nationally well known acts was being held at the Red Mile that weekend. It was arguably the largest music festival in the country that weekend and it was the thousands of attendees that snapped up all of the Lexington and surrounding areas hotel rooms.
Also the state baseball championship and the high school track and field championships but nothing was going on that weekend!! Lol
 
I expect an attendance bounce this year with the hiring of JB. For the long haul, winning is what will keep people coming back. And winning needs to include beating the best in the Conference at least occasionally, and being competitive with them 95% of the time.

This season is critical for JB. If he could pull off say a 10-win season(I know that's asking a lot) that would build a lot of momentum both with attendance, and recruiting, especially in the transfer portal. Want more people in the stadium you need to be one of the Big Dogs in the Conference, not an also-ran.
 
There’s a lot more to the attendance situation than wins and losses. MOST of everyone’s fanbase watches games remotely. That’s mathematically a fact.

You have to show people that being AT the game is the better option. That’s what your athletic department does, or in our case, doesn’t.

Sure winning helps. But we haven’t been dogs in football like we have in men’s basketball. And our football attendance recently has been among the worst in FBS. It’s declining in an expanded stadium which had never happened.

We have no marketing function that really accomplishes anything. They’re amateur replacements cashing paychecks…
 
  • Like
Reactions: vivid_red
Marketing helps but winning is what drives attendance. You are right, we have not been dogs but we have largely gotten our wins against the bottom feeders in our league and the easier non-conference games. Since we joined the ACC(last 9 seasons) we have a regular season record of 59-48. And 3-4 in Bowls.
Against the best competition here is how we did:
Clemson 0-8 (lost in 2017 77-16) Played them tough the last two seasons but still could not put a W on the board.
FSU 4-5 And in many of those Seasons FSU was not the program they used to be
Miami 1-2 Won the first, lost the last two handily
UK 2-7 Last win was in 2017. Got blown out of all of the games since then.
ND 1-2 Won the first game at their place, and dropped the last two.
Alabama 0-1 Got crushed
Auburn 0-1 Lamar's debut. His second-half effort kept us from getting embarrassed.
Georgia 0-1 - Got Crushed
Ole Miss 0-1- Got Crushed
LSU 0-1 - Got Crushed
Houston 0-2 Got embarrassed there in 2016 when we finished the season 0-3

What it will take to get our home crowds back to a 50,000 to 55,000 per game average is both
winning football and being competitive and racking up a decent number of wins against the better teams
we play. People won't accept Fake Juice.
 
  • Like
Reactions: Guardman
Too many people I know have stopped going to games and don’t miss the experience. U of L has given former paying fans an opportunity to experience that, and now there’s a fight to get them back.

That’s the key to keeping your attendance up. Get fans writing checks by reflex, and don’t lose them. Once lost, the job is 10X harder. You don’t have to attend games to be a fan…
 
  • Like
Reactions: vivid_red
By the way, U of L had a major press opportunity last week when budgets were publicized. Would have been a great time to put out a big number for football ticket sales. Unless I missed it, nothing was said…
 
The marketing of which expansion has been more successful based on occupancy? The Flight Deck or the Pepsi Club? There are fans that moved from the stadium to the End zone expansion. I doubt as many opted from the stadium to the Flight Deck.
 
I posted this info awhile back for the history of our stadium capacity...

We've never had a problem with "overbuilt" stadium expansions. That's new spin on a problem with current/recent management.

Fball-Attendance-v-Capacity.jpg

It also coincides with info in the OP...
 
Operating revenue from football is greater today. There are fewer fans now paying more for the "experience." It cost far more to be in the North End Zone and the stadium than it does to be in the Flight Deck.
 
If you're looking at operating revenue as reported by the outside auditors, they include ACC media revenue which has nothing to do with attendance,

I track what I call "game day" revenues which have been declining. That's the sum of ticket sales, suite rentals, loge seats, parking, and concessions. Here's a condensed set of numbers:

2018: GD Revenues = $18.4 million
2020: $18.8 million
2022: $17.2 million
2023: $14.4 million

These numbers are direct from U of L reports and aren't adjusted for inflation or the number of home games played.

Conference revenues have increased 50% in that same time frame. "Operating" revenues reported by the outside auditors are driven by those funds and mask what's going on that's stadium operations related...
 
Last edited:
UNIVERSITY OF LOUISVILLE ATHLETIC ASSOCIATION, INC. (pg 14 or so of each report)
A Component Unit of the University of Louisville
Statements of Revenues, Expenses, and Changes in Net Position
FB operating revenue 2018 - 2022 = 195, 453K
FB operating revnue 2012 - 2017 = 156, 204K
 
2012-2018 is history under the prior regime. I was quoting recent history since.

Again, you have to look at what they call "operating" revenue by component. Operating revenue is footnoted in the annual reports as including (ACC) media revenue.

I also have crunched stadium related revenues on a per capita basis which account for fans upgrading or downgrading their seats. IIRC that revenue per fan has also been declining recently.

Lower attendance and less revenue per fan attending is obviously not a good combination...
 
I was quoting what was in the ULAA Financial Report. According to you the "Official" numbers. There are no footnotes in the report that says the reader needs your interpretation of the numbers.
 
I took a look at the attendance over the 25 Seasons the Cards have played in Papa Johns L & N Credit Union Stadium. I was interested in attendance as a percentage of Capacity since there have been 3 different capacity levels over the years.

The original capacity was roughly 42K. The highest average attendance was 41,619, 99.1% of capacity.
That occurred in 1999, JL Smith's second season when the Cards went 9-3. That was nearly matched in 2006 when the Cards went 12-1 in the final year of BP1.0. Attendance averaged 41.482 (98.8%)

It's no surprise that the largest attendance year when the stadium increased to 55,000(2011) was 2016, Lamar Jackson's electrifying Heisman Season. AVG attendance climbed to 54.065, 98.3% of Capacity. In 2013 Avg attendance was 52,914, 96.2% of capacity in Strong's final Season when the team went 12-1. The attendance was almost identical in 2014, our first season in the ACC and the beginning of the BP2.0 era. Avg Attendance was 52,972, 96.3% of capacity when the team posted a record of 9-4.

Since the Stadium expanded to 60,800 in 2018, the highest AVG attendance was 50,251(82.6%).
Attendance has steadily dropped since then. In 2022 it was 41,692 (68.8%). That attendance barely
topped the 1999 attendance when the Stadium Capacity was 42,000.

We need to get back to the 95% level. I think that can happen if we get to the point where we are serious contenders in the ACC.
 
I was quoting what was in the ULAA Financial Report. According to you the "Official" numbers. There are no footnotes in the report that says the reader needs your interpretation of the numbers.
I thought you recommended reading the footnotes in annual reports. In this case, it amounts to a lot of money that doesn’t come from fans attending games…
 
To clarify, the attendance numbers in post #15 are averaged over the years shown. I didn’t have data prior to 1975 for the Fairgrounds. But in each stage of the various expansions, I tried to capture all of the attendance stats…
 
I thought you recommended reading the footnotes in annual reports. In this case, it amounts to a lot of money that doesn’t come from fans attending games…
The name of college sports IS money (revenue). To get as much of it as possible. When you add up the reported FB revenue numbers from the ULAA report you get what I posted.
 
This thread’s about football attendance. Everyone in P5 football is getting more football related revenue. That’s not news.

In U of L’s case and probably many other teams, it’s enough to offset revenue losses from actual attendance/stadium related revenues. Conference revenues are how your attendance goes down, and you still get more money.

Also in U of L’s case, however, higher football revenue is not enough to avoid departmental deficits because our expenses are too high. If we’re switching the discussion to finances, we have to include expenses to gauge performance…
 
Last edited:
2018-2022 Attendance Average: 39,458.20
5-Year Filled Stadium Capacity 64.90%
2022 Average Attendance: 41,692
2022 Filled Stadium Capacity 68.57%
The average attendance ranks louisville #39 out of 133 schools.
 
  • Like
Reactions: Guardman
You’re playing P5 football. Obviously your attendance should rank in the upper half of FBS.

But the problem isn’t where you are, it’s where you’re headed. That’s what the data in the OP tell you. And your stadium related revenues are headed down as well.

Our ability to exploit our stadium capacity, premium seating, amenities, etc. hasn’t been this bad in modern history…
 
So this thread really is not about Louisville's attendance and how it stacks up against other similar schools, It's really about your critique of Louisville FB attendance and your continuing bad-mouthing the Admin. I'm going to pass.
 
  • Like
Reactions: OldhamCard335
You’re doing an exemplary job of “passing.”

This thread is another example of where the current administration is falling short. A lot of negative stuff started happening about five years ago. A few holdouts still claim COINCIDENTALLY, which is a joke that’s only getting bigger.

Old subject, new evidence. And hopefully, a declining number of holdouts…
I see by the massive number of replies and overall participation in this thread that this subject is of the utmost importance to the fanbase. They passed way before I did.
 
I see by the massive number of replies and overall participation in this thread that this subject is of the utmost importance to the fanbase. They passed way before I did.
I think it's more an indication of the number of holdouts. In this thread, you're carrying the flag...
 
ADVERTISEMENT
ADVERTISEMENT