

The athletics budget was approved at a ULAA meeting on Friday, and I’ve read a couple reports about it in the media. But I seldom read anything in the way of true analysis on the budget, and there’s a lot in it that can be picked apart. My personal favorite is to look at the individual sports and how they’re trending as far as budgeted expenses. This is what we’re planning to invest in each sport and how they compare to one another.
This graph goes back more than a decade and normalizes expenditures to a base of 100 in 2011. The last budget set by Jurich was in 2018, Tyra had his hands all over the next four budgets, and Heird put together this coming year's.
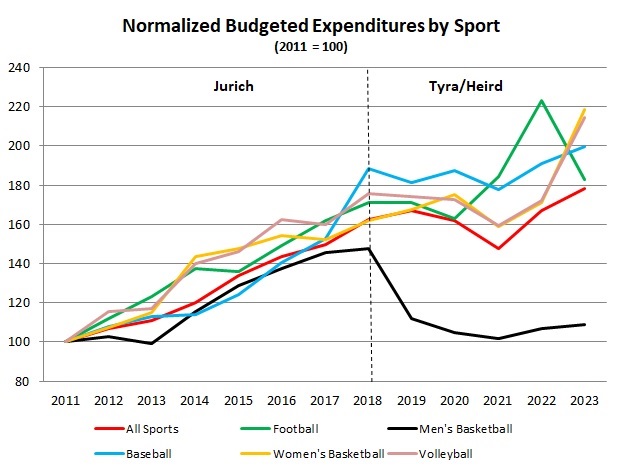
Using 2011 as a base of 100, the Consumer Price Index (CPI) in May 2018 was 112.17, or about 12% higher than inflation measured in May 2011. The various sports ranged from a low of 147.60 in men’s basketball to 188.25 in baseball. The “real” increase (inflation adjusted) in the budgets between 2011 and 2018 for these sports went from +31.6% in men’s basketball to +67.8% in baseball.
Now fast forward to this year… The individual sports in the above graph show the following changes in Y-O-Y budgeted expenditures…
All Sports +6.6%
Football -18.1%
Men’s Basketball +1.5%
Baseball +4.6%
Women’s Basketball +27.8%
Volleyball +24.7%
May CPI +8.6%
The football budget had an outsized increase of 21.1% last year (inflation was +5.0%). So, this 2023 decline reflects what may have been just a one-year bump higher in 2022. Men’s basketball continues to be the stepchild of the department financially with a small increase that is currently well below inflation.
It’s interesting that both women’s basketball and volleyball are seeing huge % increases this coming year. And these sports had great seasons and are run by coaches who can get jobs just about anywhere in the country.
Speaking of which, Dan McDonnell may have a bone to pick with baseball’s 4.6% increase. That may in large part explain why he’s been more outspoken recently about people getting back in the boat with their U of L support. He’s seeing an inflation-adjusted DECREASE in his funding, and that’s another guy with job options.
The following graph is derived from the one above and starting in 2018 with a base of 100. This is the financial report card for U of L athletics under what I call the “new regime”.
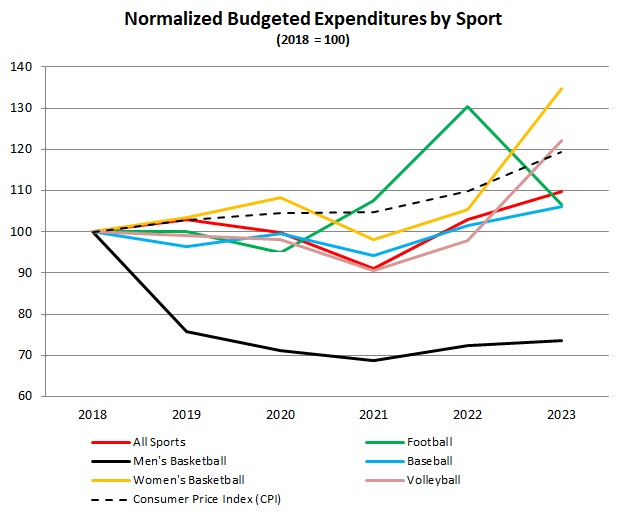
Only women’s basketball finances are running significantly above inflation (+12.9%) the last five years, and that sport trailed inflation the first four years of that time period. With 2023’s large increase, volleyball is now pacing with inflation (+2.3%) since 2018, and the rest of the sports are meaningfully behind. Sports overall are 8.0% behind inflation since 2018, football and baseball are 10.6% and 11.2% behind, respectively, and men’s basketball lags inflation by a ridiculous 38%. …All of those results are under the new regime.
You can’t have successful sports and happy head coaches when you’re starving them of needed resources. A $7 million Y-O-Y increase in the budget sounds good, but there’s obviously more to that story when you get down to the sports involved and how the coaches probably look at their situations. If anyone has any questions or constructive comments, fire away...
This graph goes back more than a decade and normalizes expenditures to a base of 100 in 2011. The last budget set by Jurich was in 2018, Tyra had his hands all over the next four budgets, and Heird put together this coming year's.
Using 2011 as a base of 100, the Consumer Price Index (CPI) in May 2018 was 112.17, or about 12% higher than inflation measured in May 2011. The various sports ranged from a low of 147.60 in men’s basketball to 188.25 in baseball. The “real” increase (inflation adjusted) in the budgets between 2011 and 2018 for these sports went from +31.6% in men’s basketball to +67.8% in baseball.
Now fast forward to this year… The individual sports in the above graph show the following changes in Y-O-Y budgeted expenditures…
All Sports +6.6%
Football -18.1%
Men’s Basketball +1.5%
Baseball +4.6%
Women’s Basketball +27.8%
Volleyball +24.7%
May CPI +8.6%
The football budget had an outsized increase of 21.1% last year (inflation was +5.0%). So, this 2023 decline reflects what may have been just a one-year bump higher in 2022. Men’s basketball continues to be the stepchild of the department financially with a small increase that is currently well below inflation.
It’s interesting that both women’s basketball and volleyball are seeing huge % increases this coming year. And these sports had great seasons and are run by coaches who can get jobs just about anywhere in the country.
Speaking of which, Dan McDonnell may have a bone to pick with baseball’s 4.6% increase. That may in large part explain why he’s been more outspoken recently about people getting back in the boat with their U of L support. He’s seeing an inflation-adjusted DECREASE in his funding, and that’s another guy with job options.
The following graph is derived from the one above and starting in 2018 with a base of 100. This is the financial report card for U of L athletics under what I call the “new regime”.
Only women’s basketball finances are running significantly above inflation (+12.9%) the last five years, and that sport trailed inflation the first four years of that time period. With 2023’s large increase, volleyball is now pacing with inflation (+2.3%) since 2018, and the rest of the sports are meaningfully behind. Sports overall are 8.0% behind inflation since 2018, football and baseball are 10.6% and 11.2% behind, respectively, and men’s basketball lags inflation by a ridiculous 38%. …All of those results are under the new regime.
You can’t have successful sports and happy head coaches when you’re starving them of needed resources. A $7 million Y-O-Y increase in the budget sounds good, but there’s obviously more to that story when you get down to the sports involved and how the coaches probably look at their situations. If anyone has any questions or constructive comments, fire away...
Last edited:
